For a project to be completed just as planned from the beginning, there must be a set management system to guide the team throughout the project life cycle. This management system is called Project Management.
What Is Project Management?
The Project Management Institute (PMI) defines Project Management as “the use of specific knowledge, skills, tools, and techniques to deliver something of value to people (i.e., the project).”
Anyone who is to manage a project (i.e., the project manager) must therefore have a good knowledge of the project, have the right skill needed to manage the project, and use the right tools and the proper techniques.
Among the above requirements needed to manage a project from start to finish, there is one that I want to focus on, and that is the right tools.
Tools used for project management are mainly software applications (like HillChart.co) that can aid teamwork in planning and organizing the project through its lifecycle.
These tools use project management charts to communicate with the team working on the project so they know what needs to be done, who is assigned a specific task, and their progress with the project over time.
What Are Project Management Charts?
Project Management Charts are visual representations of data relating to a project. The data on a project management chart could include the following:
- How long should a project take,
- The list of tasks to be completed,
- The team member assigned a task,
- The resource needed to complete the project,
- The order in which the team has to work on ease tasks and their dependency,
- Progress of each team member as execution takes place and so on.
A project management chart can hold all this information, making them accessible to all team members in a project management tool/software.
There are different project management charts, and each chart displays your project’s data in different shapes and forms, giving you different views and sometimes different information.
With the help of a project management chart, you can efficiently organize your project to understand and execute it from start to finish, and everyone in the team knows what to do all through the project life cycle.
I will show you five types of Project management charts that you can choose from to monitor your project, including the Hill Chart, but before we get to that, let’s see some of the reasons why a project management chart is something you should use in your next project.
3 Benefits Of Project Management Charts.
Here are three benefits or reasons why you need a project management chart:
- Easy Management Of Complex Projects.
- Time-Saving.
- Easy Tracking.
1. Easy Management Of Complex Projects:
Some projects are simple, have a short lifecycle, and, most time, require less teamwork to be executed. A project like this has little data that are easy to manage without a project management chart, although you can choose to use one.
But when it comes to a complex project requiring lots of teamwork throughout its lifecycle, project management charts are beneficial in this case.
This is because projects like this have more data and more tasks need to be completed before the project can be completed, and most times, you can’t keep track of everything on paper, at least not the way a project management chart would.
A project management chart makes it easier to manage a complex task from start to finish.
2. Time-Saving:
Another benefit of using a project management chart is that they help you save a lot of time while working on any project, regardless of the project management methodology you are using.
When all the data relating to a project are in a project management chart, and every team member has access to it in the project management software, you don’t have to spend much time going front and back to figure out what to do next.
You also don’t have to organize meetings with the team because the progress of everyone can be viewed right on the chart in your project management tool. With this, you can save a lot of time while working on the project.
3. Easy Tracking:
The benefit of being able to track your progress on a project is actually gotten from a project management tool/software. Still, I decided to include it here because these tools use the project management charts to achieve this.
All changes made on a project management chart throughout the project lifecycle are stored in the tool/software. With this, you can track the team’s progress and know who is making progress and who is stuck.
You can also view how everything has been moving from the beginning of the project to the current date and know if you need to make some adjustments to improve the team’s overall performance on the project.
With all these benefits you gain from using a project management chart while managing your project with your team, it is clear now that you need to work with a project management chart. Now here are five different charts you can choose from. (Try out the Hill Chart)
5 Types Of Project Management Charts.
- Hill Chart.
- Gantt Chart.
- Flow Chart.
- Work Breakdown Structure.
- PERT Chart.
1. Hill Chart:
A hill chart is a project management chart that graphically represents the progress on different tasks in a project using a hill-like shape. It does this by representing each task with a point on the chart, which the team can move as they make progress on each task.
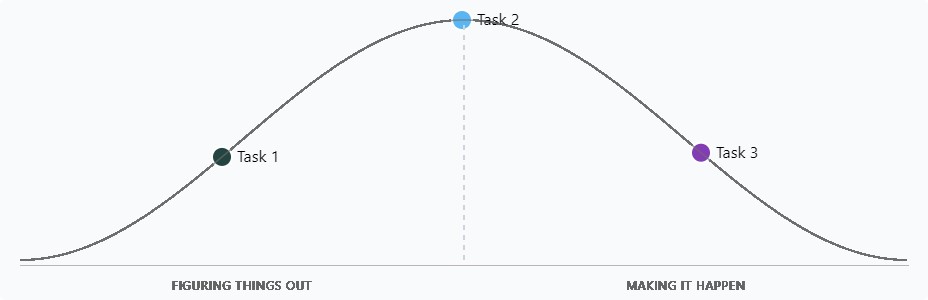
On a hill, there are two sides, the uphill, and the downhill, and the hill chart uses this side to divide all project tasks into two phases. The Uphill phase represents the problem-solving stage, and the downhill represents the execution stage.
After outlining all the tasks you and the team need to complete for a project, you then place a point on the hill chart and name the point according to the task it represents. If the solution to the task is uncertain, you place the point in the uphill phase, but if the solution has been figured out, then you can place the point on the top of the hill.
As the team progresses on each task, they move the point representing that task forward to represent the progress made either uphill or downhill. With this, you can track the progress of everyone on the team.
Using the hill chart gives you access to a lot of benefits, and this is a chart I recommend you use when managing your next project. Read the guide on using a hill chart to learn how to use the hill chart.
2. Gantt Chart:
A Gantt chart is a type of bar chart that communicates the relationship between tasks within a project and their time duration. The horizontal axis of the chart shows the time, while the vertical axis contains the list of the tasks in the project.
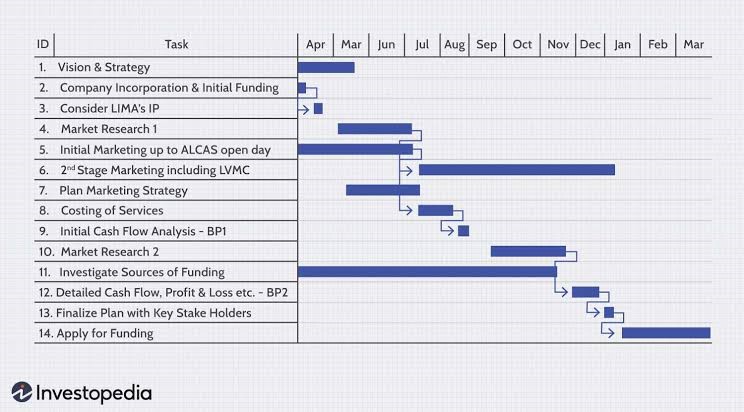
Source: Investopedia
The Gantt chart was named after its inventor Henry Gantt, a management consultant, and it has been employed on major infrastructure projects since the 1990s. This show that this is an effective project management chart.
With a Gantt chart, you can plan the entire project from the starting to the ending date and visually represent how long it takes you or any team member to complete each task using the bars. A Gantt chart can also be used to display the dependency of a task on the other, so the team knows where to start when it comes to the execution stage.
Gantt chart displays all tasks in chronological order, so each day you view the chart, you can directly figure out what task needs to be done for that day and immediately move to executions. It also contains the names of the team member to perform the tasks.
Among all the project management charts, the Gantt chart is mostly used by professional project managers, and you can also try using it. Check out Gantt.com to get started.
3. Flow Chart:
Another type of project management chart is the flow chart which Frank and Lillian Gilbreth introduced. The flow chart is a graphical representation of the workflow or process taken to complete a project.
A flow chart is used to arrange tasks in a logical order in which they will be executed, i.e., from the first task, the starting point, to the next, to the last task that completes the project, but as this might sound simple, there are projects that require complex flow charts and don’t have a straight-down flow.
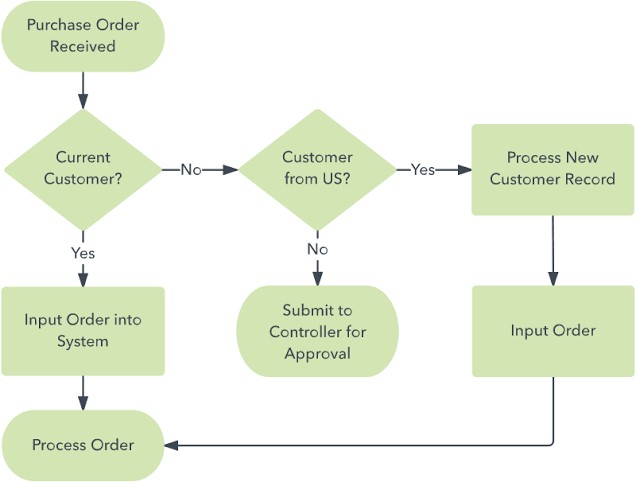
The flow chart contains boxes or any other shapes (representing each task or event), linked together by arrow-headed lines to indicate the sequence in which each task or event will happen in the project lifecycle.
You can check this Flowchart Guideline to learn how to employ the flowchart in your next project to ensure that all logical aspects of the project are entirely taken care of through the project lifecycle.
4. Work Breakdown Structure:
Work Breakdown structure is a project management chart that help visualizes the breakdown of a project from the main task to the subtask and so on. It is a tree-like structure that decomposes a project into phases or deliverables.
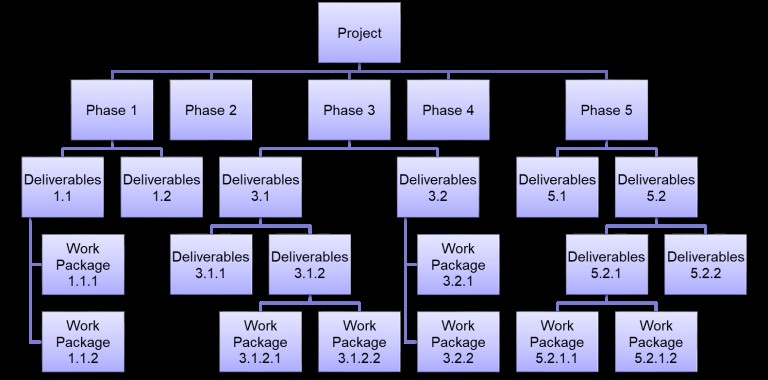
With the work breakdown structure chart, all you have to do is brainstorm your project and figure out all the tasks needed to complete the project. This helps you break the project into easy and manageable sections that the team can handle easily.
Note: When using the work breakdown structure chart to manage your project, you need to ensure that the chart contains 100% of the work or tasks in the project. This is referred to as the 100% rule.
I believe the 100% rule also applies to other project management charts, as it ensures that you don’t miss out on crucial steps in any of your projects. You need to know what it will take to complete a project from the beginning, even before starting out.
This is one reason why the development of the work breakdown structure chart is usually done at the start of a project, that is, in the planning stage.
If this is a project management chart you want to try, check out WorkBreakdownStructure.com and get started.
5. PERT Chart:
The PERT chart is a project management chart used to map out a project timeline in a way that is quite similar to the work breakdown structure.
PERT is an acronym for Program Evaluation Review Technique. It is a network diagram that graphically represents events or milestones in a project and what task has to be done to achieve each of the milestones.

A milestone is represented with a box or circle and referred to as a node, while the arrows between them show the required task to achieve the milestone.
One benefit of using the PERT chart is that you can easily find the dependency of each task, just like you would with the Gantt chart. You can also figure out the sequence the team should follow while working on the project.
Like the Gantt chart, developing a PERT chart for your project also requires estimating the time you want to achieve each project’s milestones. The time, usually measured in days, is placed on the arrows telling the reader how many days it will task to reach the next milestone.
As you and the team work on the project and things don’t go as planned in the PERT chart, you can adjust it to reflect the actual timeline of the project.
For more information on using the PERT chart, check out the tutorial by Simplilearn on the PERT Chart.
Which Chart Should You Use?
After going through the five project management charts, I know you want to know which one of the project management charts will be great for your projects. Here is what I have to say about that.
Every project management chart graphically represents your project in different ways, communicating different information on a project to the reader. Because of this, there isn’t a project management chart that can be said to be better than the others.
When managing a project, if you are comfortable working with just one project management chart, then that is fine, but for most projects, you might need to work with different project management charts to get a different view of your project. With Hillchart.co, you can set up a hill chart within minutes and work with other tools to set up other charts.
3 benefits of using a Hill Chart
Here are three benefits of using a Hill chart while working on a project:
- Easy To Understand.
- The View.
- Tracking of progress over time.
1. Easy To Understand:
Hill chart graphically represents your tasks in a way that is easy to understand the status of each task in a project.
With each point on the hill chart representing each task in a project, the uphill shows that the task is in its problem-solving stage, and the downhill shows that the task is in its execution stage and should be completed soon.
All of these are easy to understand, and I can say that the Hill chart is one of the most straightforward projects management charts to work with since every team member can understand how it works and get to interact with it as they make progress by moving the point representing the task they are working on.
2. The View:
Using a hill chart when working on a project allows you to zoom out and see the progress made on each task in a project. Ryan Singer, the inventor of this chart, calls this the bird’s eye view.
With a glance at the chart, you can see the team’s real-time progress and know when things stand in the project and at what stage each of the tasks is currently.
This can guide you as a project manager to know what the team has done even without organizing a meeting with them because as they progress and move the point for their task, they also add short notes on what they did that prompted the movement of the point.
A view of all these in one chart is a benefit hill chart can offer you, your team, and the executives.
3. Tracking Of Progress Over Time:
Like with every other project management chart, you can also track your progress on a project with a hill chart and store it as history, but unlike the other project management chart where all you can see is the date a task was marked done, Hill Chart gives you access to more clear history on the project.
You can see how long it took the team to figure out the right solution to each of the tasks when execution began and how fast the completion of some tasks was and the others weren’t. All this can help in planning for the next projects ahead.
With the hill chart, you can quickly identify tasks stuck in one position for a while and arrange a meeting with the team members handling that task. This is an effective way of tracking progress with your project; a hill chart makes it easier.
These are the major benefits you gain from using a hill chart as your main project management chart.
Conclusion:
When working on a project, it is very important to work with a project management chart to aid in planning, execution, and visualization of the data related to the project.
Using a project management chart comes with many benefits, and we were able to discuss three of them earlier. This makes it clear that you should work with a project management chart in your next project if you don’t use one now.
Like I said earlier, there is no one project management chart that can be said to be better than the others but still, you need to start with one of the charts I explained earlier, especially if it is your first time working with a project management chart.
For a start, I recommend you work with the Hill chart, as this is a straightforward chart that is easy to understand. As you get more comfortable with it, you can add another chart if necessary.
Go through our guide on the Hill chart to get started today.