You are probably here because you heard about this new chart, Hill Chart, and you want to know what it really is and how to use it to get the best while managing your projects with your team.
In this article, I will explain what the Hill Chart is, and how to use it. You get to know the benefit of using HillChart.co as a tool to manage your project. Let’s begin this with the definition of the Hill Chart.
What Is A Hill Chart?
A Hill Chart visually represents the progress of different tasks in a project using a hill-like shape. Unlike other charts used in visualizing an organized projects, Hill Chart gives you a good view of the progress on each task, so you get to know what you are getting done and where you or the team is stuck.
The Hill Chart does this by using points to represent each task needed to be completed to finish a project, and as each team member progresses on any of the tasks, they move the points forward.
The team member moving any of the points can add a statement saying what they actually did that made them move it, and all other team members can view this to know where they are on the project.
The Idea Behind The Hill Chart.
(How The Hill Chart Works).
The Hill Chart was developed by Ryan Singer when he was the Head of Strategy at Basecamp. He introduced the idea when he launched his book, ShapeUp and started that the hill chart was developed to enable teams have a bigger picture of their project; a picture to-do list cannot give.
This bigger picture shows you what task is moving and what task is stuck, enabling the team to know where things really stand with the current project even without spending time in a meeting.
The Hill Chart achieve this by dividing tasks into two phases:
- The Uphill Phase.
- The Downhill Phase.
1. The Uphill:
The Uphill phase is the first phase of every task, which is often described as the phase of unknowns, uncertainty and problem-solving. This is the part when you are to move the point representing a task up the hill.
When working on a task, there are times where you know what you want to achieve at the end but how to achieve it is something you are yet to figure out. This is the case for many developers or technical workers.
To get the task done, you first must go through a lot of thinking and planning to get the solution or the right way to handle the task. At this point, everything is unknown and uncertain; you are in the problem-solving phase.
As you gradually begin to figure out the perfect solution for the task at hand, you move the point for that task Uphill.
This continues until it gets to the point when you have gotten it all mapped out, and you know what needs to be done to complete the task. At this point, you are standing at the top of the hill, and this is where the point for the task should be.
When you get to this part of the hill, there is just one more phase left: Downhill.
2. Downhill Phase:
After the ride up the hill, the next phase is the Downhill. In this phase, all that is left is execution because the solution to the task is now certain, and you are confident of the steps to take to complete the tasks.
In this phase, you move the point representing the task down the hill as you take action daily. When the task is eventually completed, the point should be at the bottom of the hill.
You can decide to remove the dot presenting a task when the task is completed, and the team can see what tasks are yet to be done with their phases (uphill or downhill).
That is the main idea Hill Chart uses to communicate with you and your team on your project. Now let’s check out the best ways to use a Hill Chart to improve teamwork in a project.
Best Practices When Using A Hill Chart.
When you are working on a project, and you want to use the Hill Chart to get the bigger picture of your project over time as you and the team progress, here are 3 best practices:
1. Represent Your To-do List As Points On The Hill:
To finish a project, technical or non-technical, there are lists of tasks that you would need to complete one by one with the team. Most times, these lists are written out as To-do lists.
To make use of a Hill Chart, the first thing you want to do is to represent each of these tasks in the To-do list with a point on the Hill Chart.
If you are just starting the project and the solution to the tasks are unknown, you can place them all at the base on the left side of the hill.
But I believe that for some of the tasks, the solution to them would be straightforward and clear to you from the beginning. For a task like this, you can place their point at the top of the hill.
As you make progress on each task, you can begin to move them uphill or downhill, and the team can see it all.
2. Break Down Your List When You Have Issues Finding Their Place On The Hill:
As you make progress on an easy task, you could get to a stage where you find it difficult to place a point for a task in any of the phases (uphill or downhill). This is a sign that you probably need to break down that task into smaller tasks.
Here is what I mean by that: If you have a task in the Hill Chart and, while working on it, you found out that part of the solution to the tasks has been figured out and executed, but there is some part of that same task that is still uncertain so placing that point in the uphill phase or downhill phase won’t really communicate the state of that task. The best thing to do in this case is to break down the task into smaller tasks by separating the part that is still uncertain from those that aren’t.
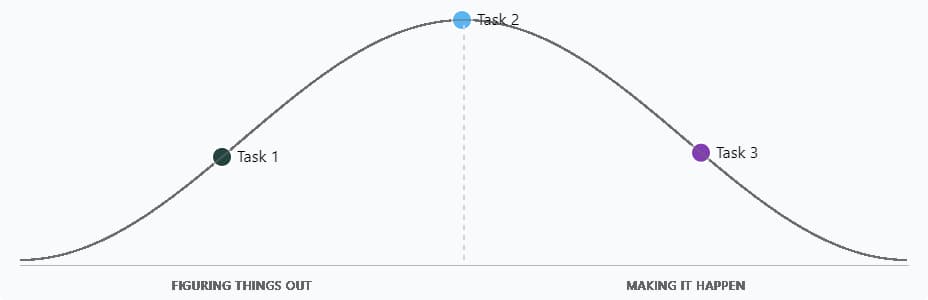
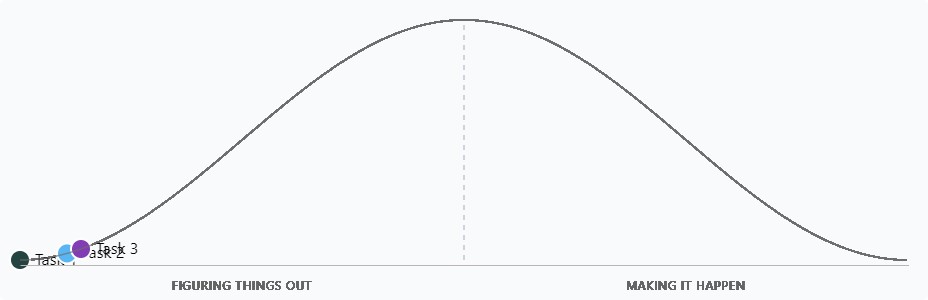
Let’s look at an example of this faced by the Basecamp team when working on a project. They needed to build a feature to notify people when an event is rescheduled.
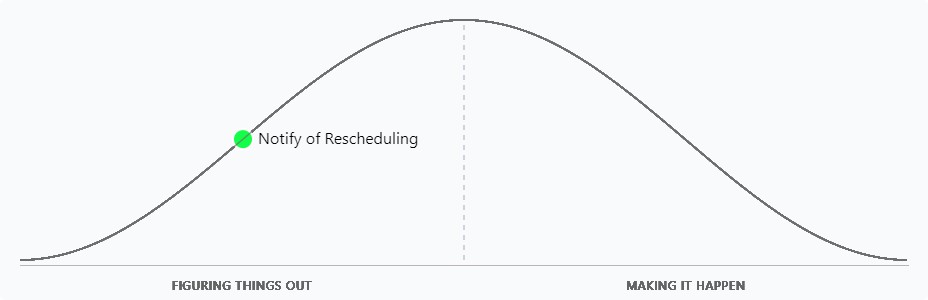
The above image shows that the point representing this task is still in the uphill phase, but one thing the team noticed was that no one moved that point after a few days into the project, and this was because part of the work was done and other were not even figured out.
To complete the tasks (building the notification feature), they needed to do the following:
- Build it in the back-end
- Set up the email to be sent, and
- Get it displayed somewhere in the front end.
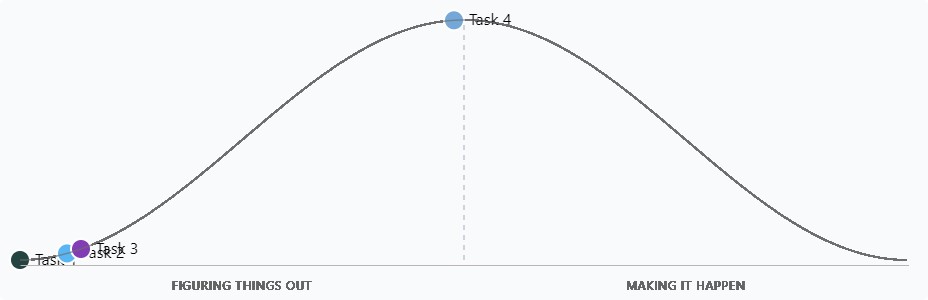
Only the back-end was nearly completed. However, the other two were still uncertain, so placing that single point (Notify of Rescheduling) either in the Uphill phase or Downhill phase was unclear. What this means is that they need to split the task into the smaller tasks and that was what they did.

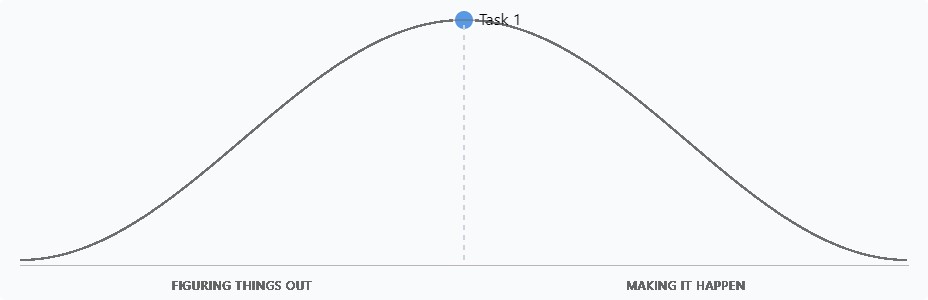
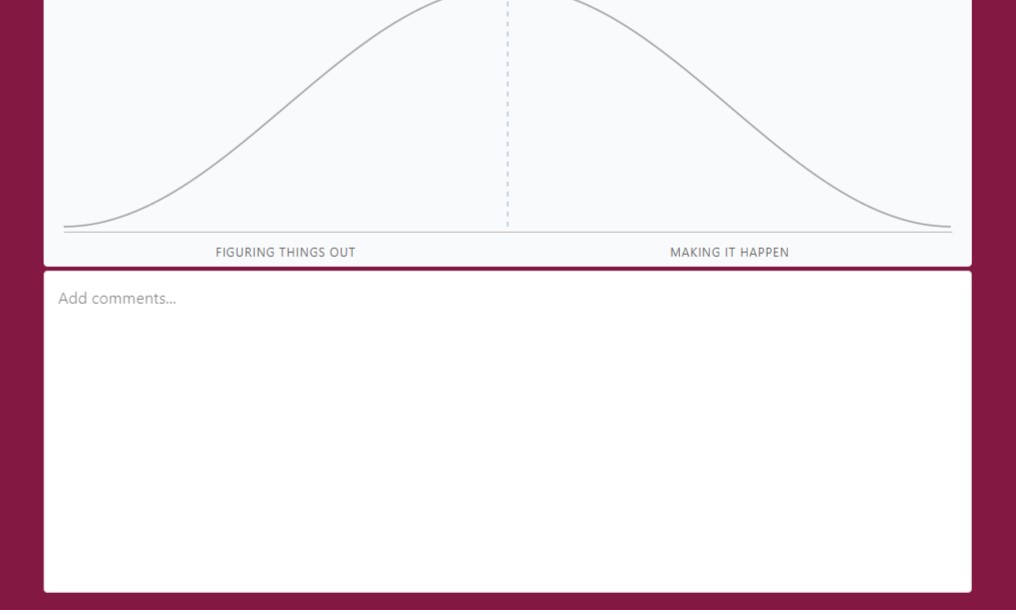
Now the hill chart clearly communicates the progress made in developing the notification feature. This is just an example.
If you ever get to any stage where you have no idea where to place the point for a task, then check that task and break it down appropriately; this would help.
3. Work All Task Uphill First:
When using the Hill Chart, one thing I would advise you do is to walk all tasks uphill first and, after worth, walk them all downhill. This help you have confidence in the project you are working on when you get to the execution stage as all the aspect of the project has been figured out and what is left is execution.
It is essential to know that this depends on the type of project you are working on and the team working on the project also. If all tasks cannot walk uphill and downhill simultaneously because one has to be completed before the other can be done, then that it is okay.
But if the team can work on their tasks and figure the solution out together before going all into the executions, this would help.
How To Use HillChart.co
HillChart.co is a free and simple to use tool that you can use to create Hill Chart for you and your team. HillChart.co priorities your privacy (I will tell you how it does this), so information about your projects is safe when you use HillChart.co. Let me work you through how to use it.
Step 1: Add The Title Of Your Project
Step 2: Add Your Points.
Step 3: Move The Points.
Step 4: Tracking Progress With HillChart.co Versions.
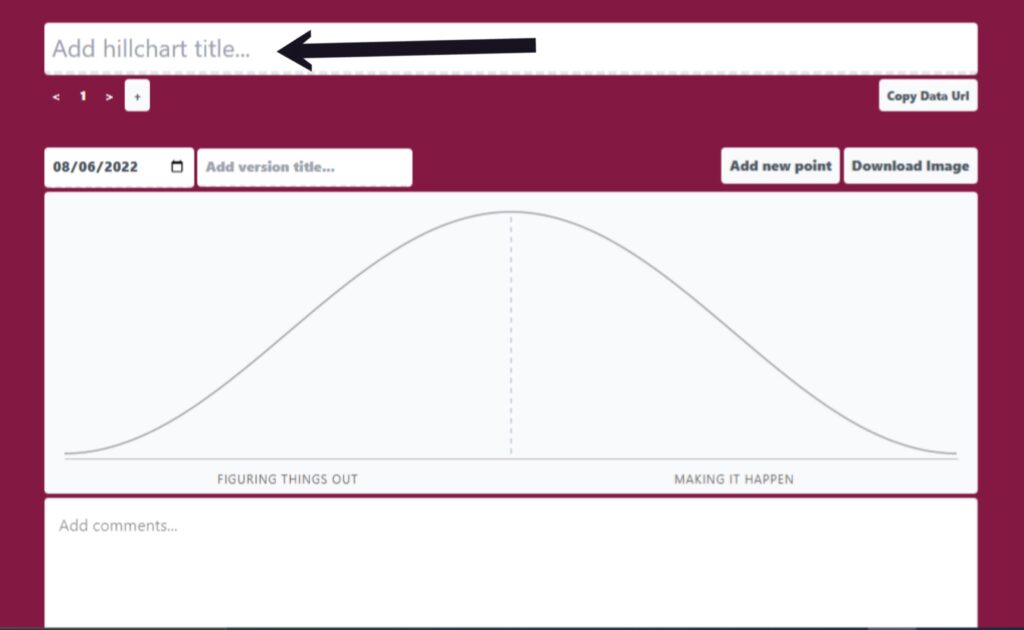
STEP 1: Add The Title Of Your Project:
To use HillChart.co, the first step to take is to add the title of the project at hand. This is necessary so that everyone in the team understands what project the hill chart is for at first glance.
After opening HillChart.co, you can place the title of your hill chart in the section that says ‘Add hillchart title…’ and then move to the next step.
STEP 2: Add Your Points:
After adding the title to your hill chart, the next step to take is to add the necessary points to the chart. Each point represents a task on your to-do list.
To add a point, do the following:
- Click ‘Add new point’.
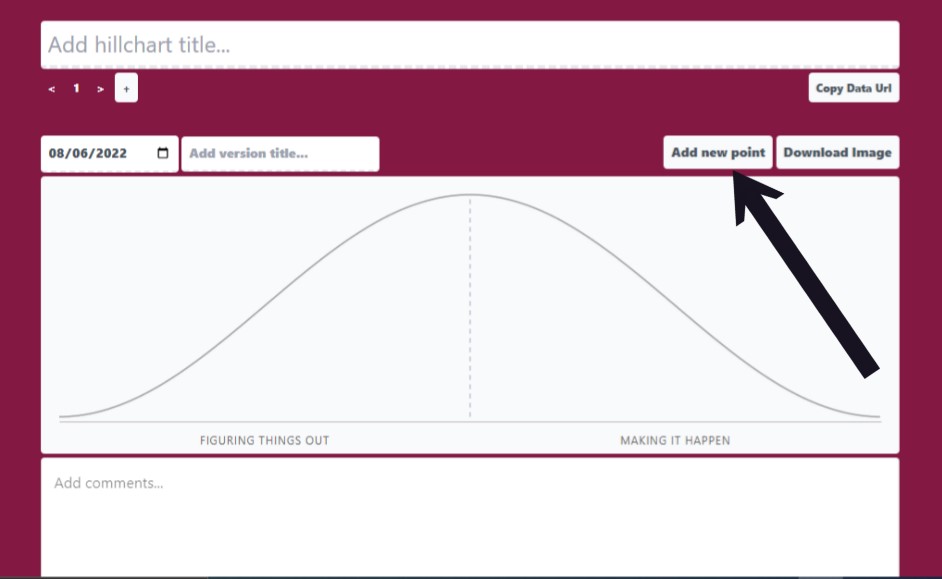
- Enter the point’s name in the pop-up (i.e. the task the point is to represent).
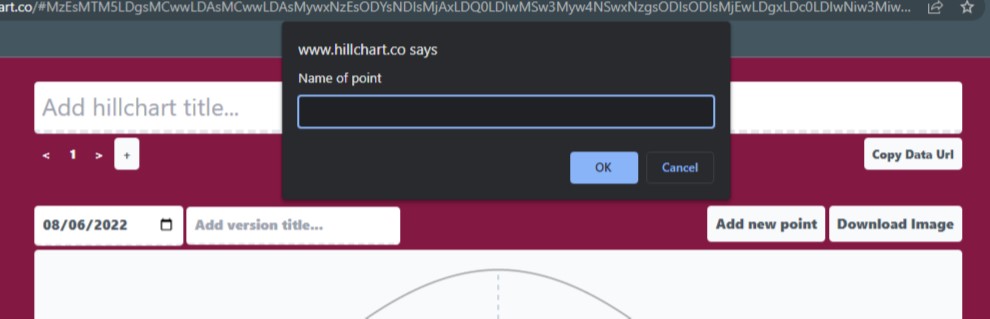
- Click ok.
When this is done, the point is immediately added in the uphill phase of the chart. You can also add the point by double clicking on the chart, and the pop-up will be displayed for you to input the name of the point.
To add another point, repeat the steps again or try double-clicking.
STEP 3: Move the points:
When each point is added to the hill chart, they are all placed in the uphill phase automatically. If you have in any way made any progress on the task, you can move the point to appropriately communicate the state of things.
When the solution to the task is actually certain from the beginning and all you need to do is execute, then move the point to the top of the hill. If it is not, you can move the point as you or any team member progress.
To move any point on the chart, all you have to do is to click and drag the point to the appropriate position on the hill.
STEP 4: Track Progress With HillChart.co Versions:
As you progress on each task and move the point representing them, you need to have a view of the changes you made over time in the hill chart.
HillChart.co gives you an exciting way to store your changes on every point on your chart, and this is done using different versions.
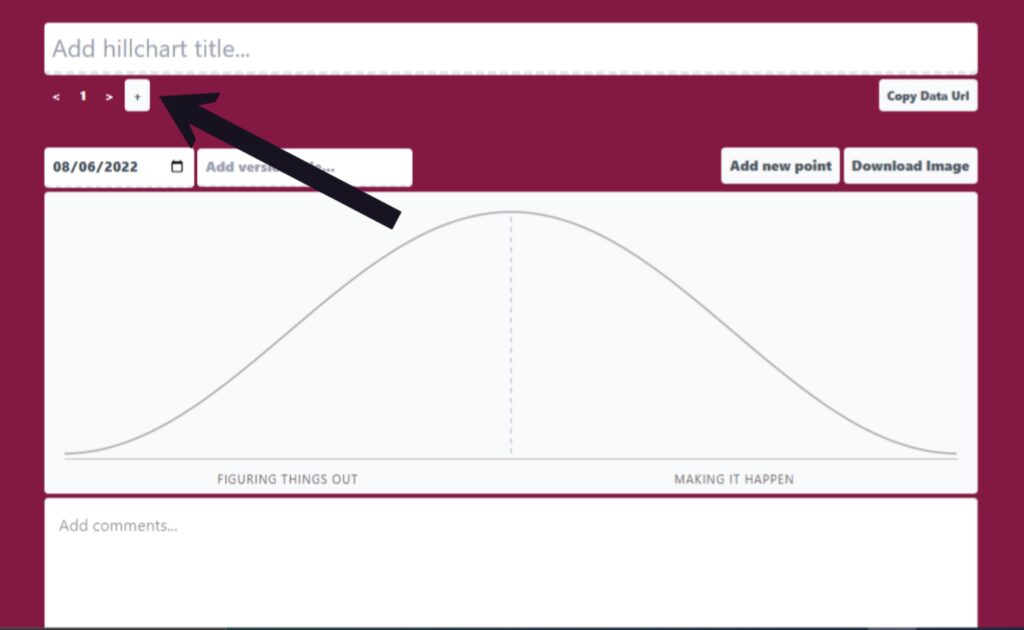
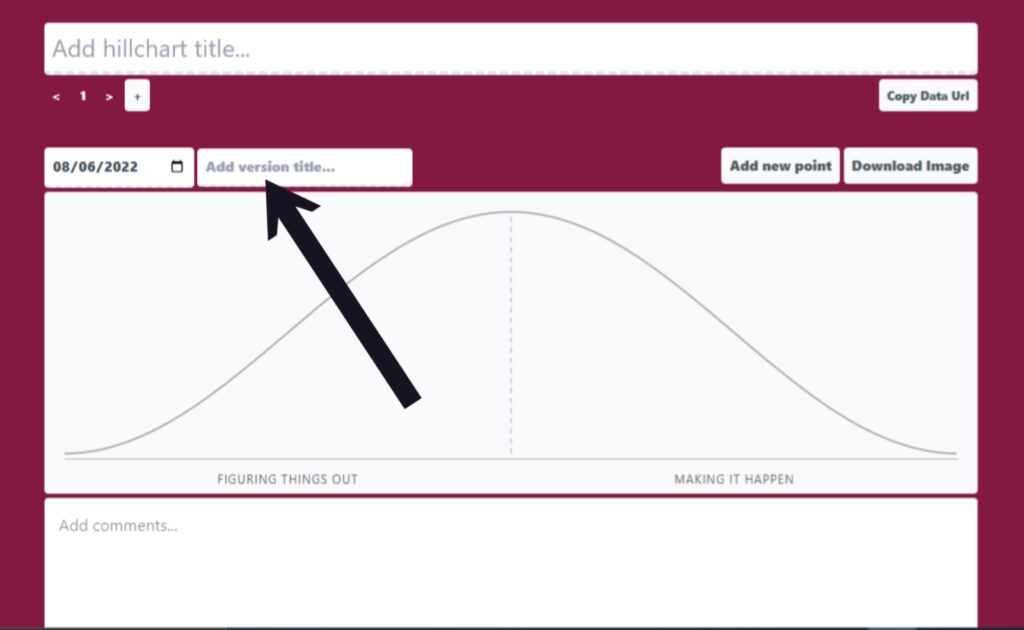
You can also give a name to each of the versions on your hill chart. Add the name here:
Any changes made to version 2 will not affect version 1, it will remain the same except you go back to version 1 and change it yourself (most times you don’t have to that).
This feature enables you to be able to track your progress with your project. The best way to use it is to create a new version each time you make progress and want to move the point to indicate your progress.
With this, you can go back to each of the versions and see how you have been making progress and how long it had taken you because each version holds the date it was created. This also help the team see who is making progress over time and who is stuck.
Bonus Step:
In addition to the four steps you have above, you can also choose to add comments to each version you created and state what you did change in the hill chart so other team members can easier understand why they have a new version added.
The comment works with the markdown format text to display information and so to use the comment section well, you have to understand how to use the markdown.
But still, you could use the comment section without knowing anything about markdown but there is limit to the customization you can achieve in the comment section without a knowledge markdown.
But below are the basic commands you might need:
| Commands | Markdown |
| Headline 1 | # your headline |
| Headline 2 (sub-heading) | ## your sub-heading |
| Headline 3 (sub-sub-heading) | ### your sub-sub-heading |
| Bold | **statement** |
| Italic | *statement* |
| Hyperlink | [statement](https://link.com) |
These are the basic command you might need to structure you comment well for more you can check the markdown guide.
Why Should You Use HillChart.co?
Now you are ready to use a Hill chart to get the big picture of all your project, why should you use HillChart.co.
Here are the two major benefits you get form using HillChart.co:
- Privacy:
- Easy Sharing.
1. Privacy:
Like I said earlier, HillChart.co is a tool that priorities your privacy and so all the information on your project are safe.
This is because none of the information or point on your hill chart are store in our server and so no one can to have access to them, not even me.
HillChart.co uniquely store all added information in the URL and only with the URL can you access your Hill chart. No one can access it except you did share the URL with them and this brings us to the next benefit.
2. Easy Sharing:
With HillChart.co you can easily share your hill chart with your team or executives and this can be down in two ways.
a. Sharing The URL.
To share the URL, all you have to do is to click ‘Copy Data Url’ and the URL will be saved in your clipboard.
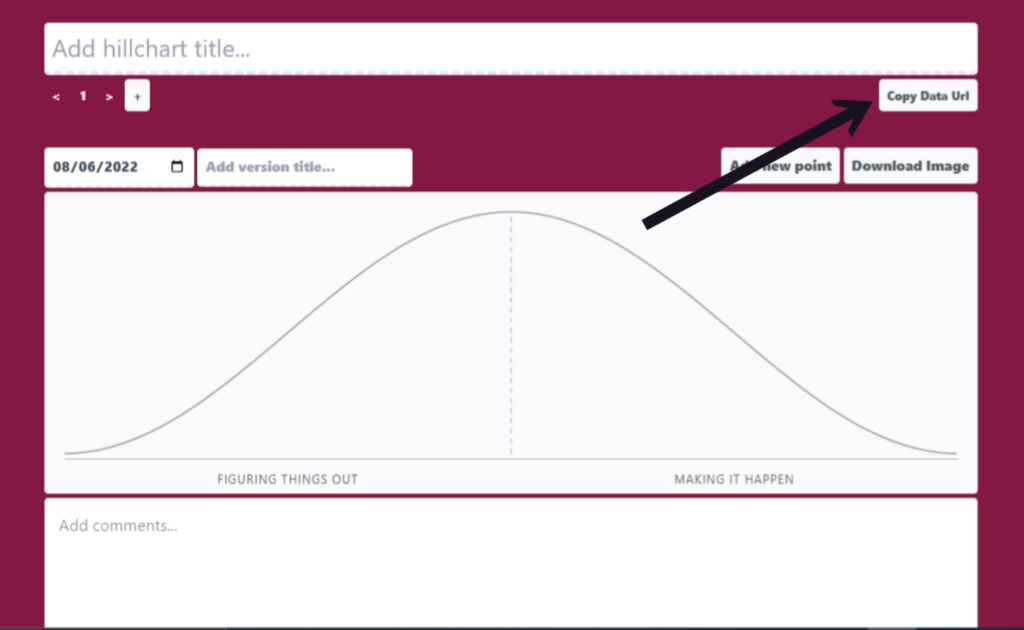
You can then paste it and share using the platform of your choice.
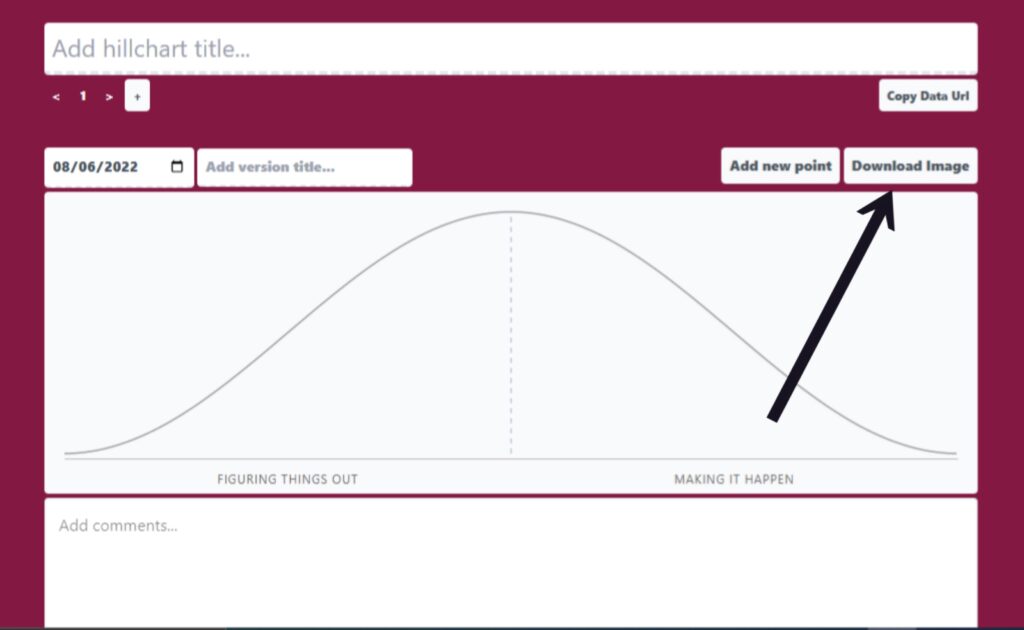
b. Sharing An Image Of The Chart.
To share the image format of your hill chart, click on ‘Download image’ and it will be saved in your device. You can then share the image.
You can choice to share your hill chart using any of the above ways, the only difference is that sharing your chart as an image will only give the team a view of the current version of the chart whereas if you did share the URL, they can view all the version and also the comments on each of them.
Note: All changes made to the chart after sharing your URL will not reflect when the person opens the URL. This is because the changes are not stored on our server, so there is no way to update them. Each time you make a change to the chart, you might need to reshare the current URL if necessary.
Conclusion.
Hill Chart is another type of chart, and like every other chart, it easily communicates with the reader, but is unique. As Basecamp put it: It gives you the bird’s eye view of what’s moving forward confidently and what isn’t.
Each point in an uphill or downhill phase tells you something, which I explained earlier in this article. You can follow the best practices I gave above to get the best when using the Hill Chart.
For your next project or your current one (if you have any), go to HillChart.co and get your hill chart set for the project. I have explained how to set it up also in this article.
You can get started now and make it easy for your team to communicate the progress of a project faster without calling meetings every time.
Good luck with your project.